We have not experienced a negative monthly return (total return) in the S&P 500 Index since October 2016, when the S&P 500 slid 1.82%. It has been a great run in the equity markets, despite a lot of teeth gnashing over valuations. In fact, our U.S. market cycle dashboard which evaluates five factors: economic, credit, valuation, momentum and sentiment, have had a negative reading for valuation factors dating back to October 2013. Mind you, the S&P 500 is up more than 71% since our valuation reading went negative.1 While it is not so rare for us to see expensive markets get more expensive, what would be rare is if the S&P 500 Index were able to generate a positive return in December, thereby making it the first calendar year in 92 years2 to have experienced all positive monthly returns. Typically, only about 60-65% of months tend to result in positive returns for the S&P.3
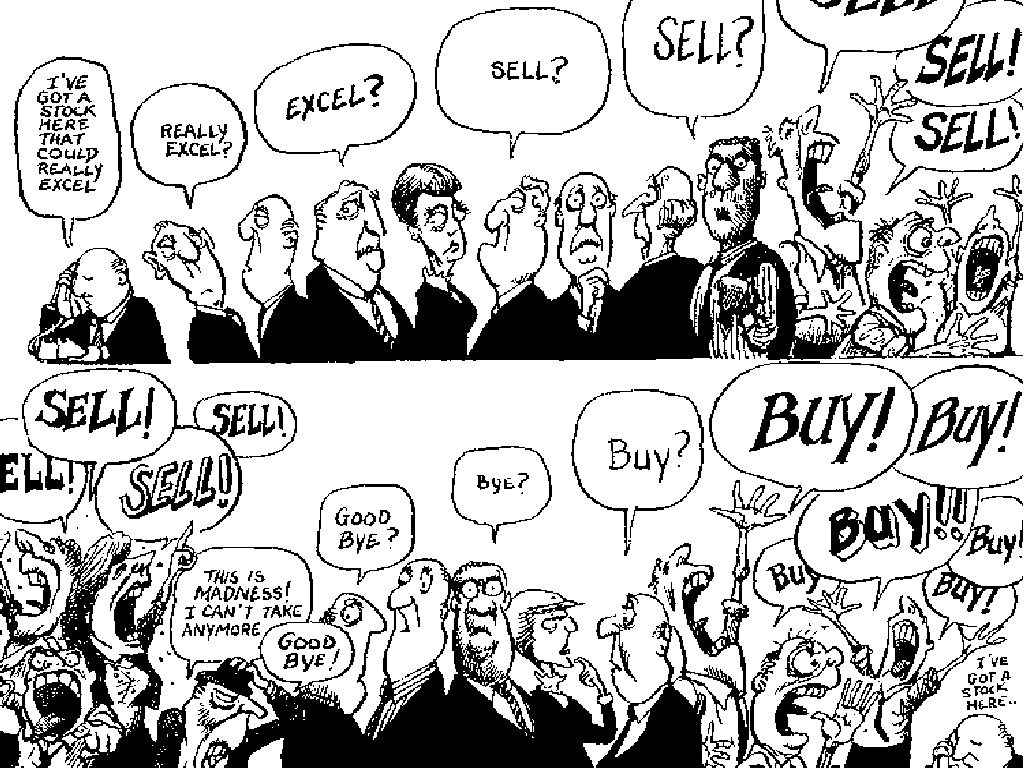
What is the significance of such an event? Nothing really, but it can entice investor psychology to lean one way or another. The average investor’s returns tends to fall well below average market returns. Why? Because the average investor tends to act emotionally to volatility, panicking and selling when market is low, and buying when it is high. Successful investors take the opposite side of that trade.
In his seminal work “A Random Walk Down Wall Street,” Burton Malkiel claimed that short-run changes in stock prices are unpredictable. Despite Malkiel’s observation, investors continue to look for patterns in the market that they can capitalize on. Evidence suggests that most investors make the same mistakes over and over—in other words, reacting to the data, usually to their own detriment.4 This highlights the need to have a thoughtful and repeatable process for making decisions in order to ensure you are prepared for whatever the market throws at you. This is not to say that there is only one right way to invest for success, but rather that it is critical to establish a discipline and stick with it.
The below diagram illustrates the emotional state of an average investor in response to a typical market cycle.
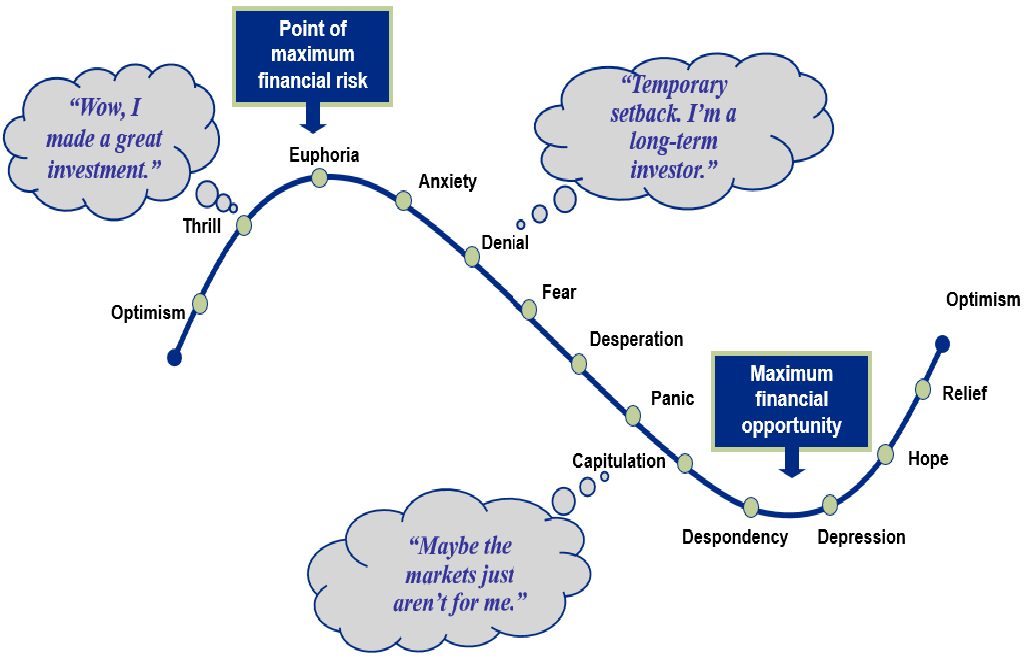
Barclays "Cycle of Investor Emotions"
For us, the process begins with our evaluation of the risk of recession. Why recession? Because the most common factor tied to bear markets (declines of 20% or more) is a recession. Yes, there can be other factors such as the Federal Reserve Bank tightening monetary policy too quickly or a commodity supply or price shock, but almost all bear markets are associated with a recession. Just as it is hard to believe (and predict) that 2017 could be the first calendar year in nearly a century to enjoy positive returns in all twelve months, it is equally difficult to predict and adequately time market corrections (declines of less than 20%) in order to make a meaningful difference in a portfolio.
How do we attempt to identify periods where there is a heightened risk of recession? We use a 36 factor, Market Cycle Dashboard, which is segmented in five categories: economic, credit, valuation, momentum and sentiment (See Chart Below). We evaluate the aggregate score of the 36 factors. The bottom-line today is that despite heightened valuations, all of the other factors remain supportive of continued economic growth. With the anticipated tax reform measures to top it off, 2018 is shaping up to be another solid year from an economic standpoint.
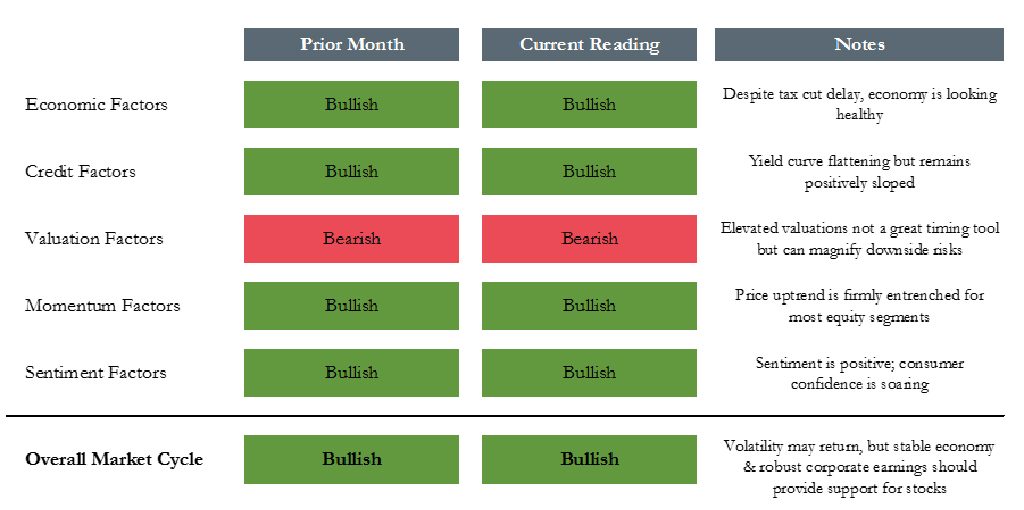
Pathstone's Market Cycle Dashboard — 5 Categories
Despite 2017 having a chance to be the first calendar year to post positive monthly returns in all twelve months in the last 92 years, available data shows it won’t be the longest winning streak for the S&P 500 Index5 . In fact, we are in the midst of the fourth winning streak over that time period that has lasted for 12 or more consecutive months, with the longest being 15 months from March 1958 to May 1959.
Markets can produce some interesting results in the near term, many of which are not easily predicted. Over time however, markets tend to converge towards historical norms. As long-term focused stewards of multi-generational wealth, we want to remain focused on our discipline and avoid the Siren’s song of the once-in-a-hundred-year type of event. It is easy to get caught up in the near term excitement of the markets, but we must remember that the most successful of investors tend to build wealth consistently over long periods of time, taking advantage of opportunities created by those that do not exhibit the same patience.