Key Takeaways
- After an up and down Q1, equity returns for Q2 were solid especially for US Large Caps and growth firms. The S&P 500 was up almost +9% for the quarter and the Nasdaq was up over +13%. US Large Cap, Small Cap, and Developed International stocks are all up double digits on a year-over-year basis, while Emerging Markets have managed just a 2.2% gain.
- Tech, telecom, and consumer discretionary sectors where all up double digits in Q2 as investors searched for growth. Energy and utilities disappointed and were negative for the quarter. Forward price-to-earnings multiples for the S&P 500 have expanded over +12% in 2023 and have expanded a whopping +32.5% for the tech sector. Forward earnings estimates are basically flat for the S&P 500 and up only slightly for the tech sector.
- After a massive runup after the invasion of Ukraine, oil prices have fallen in 9 of the last 12 months and are down almost -21% over the last year. After a similar surge, the US Dollar has fallen in 7 of the last 9 months and has dropped -1.7% over the last year. However, the dollar is basically flat in 2023 vs. a basket of other currencies and central banks around the world have continued hiking interest rates following a pause from the Fed in June. This could lead to further USD weakness.
- The anticipated rally in bonds has yet to occur anywhere other than in high yield or EM debt. The US Aggregate Bond Index is still negative YoY as are US Treasuries. Munis have fared slightly better than treasuries and have been less volatile. With the hawkish tones from the Fed, investors are finally buying into the idea that rates can still move higher from here. A recession will likely be the only event that brings rates down meaningfully over the near-term.
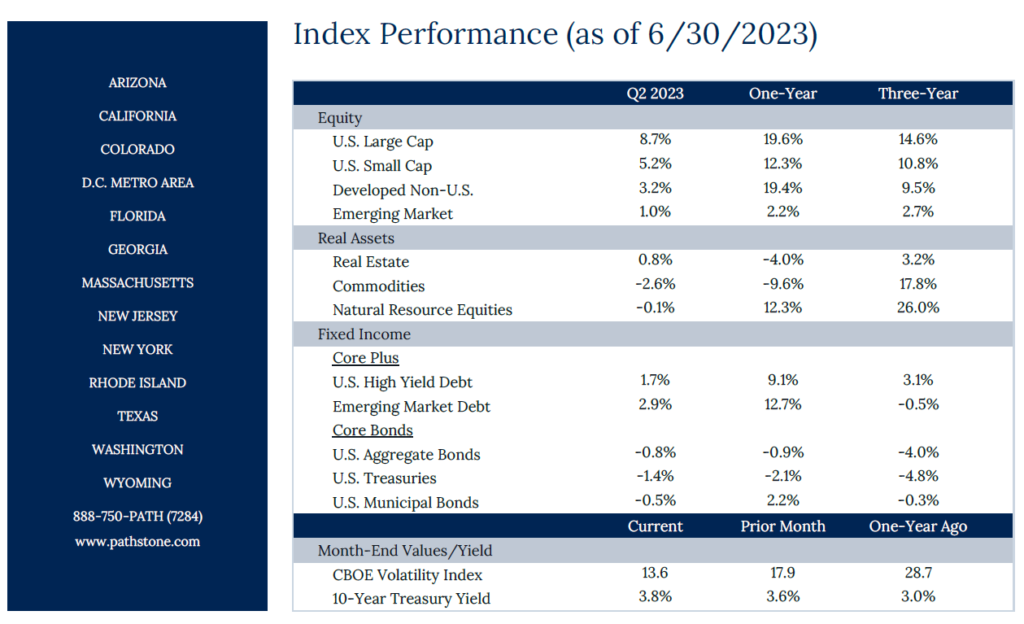
You cannot invest directly in an index; therefore, performance returns do not reflect any management fees. Returns of the indices include the reinvestment of all dividends and income, as reported by the commercial databases involved. Returns over one year have been annualized.
Source — Bloomberg, Morningstar, treasury.gov. S&P Dow Jones Indices.
Quarterly Commentary
- The Federal Reserve left the Fed Funds rate at 5.25% after raising rates for 10 straight meetings. Global monetary policy has begun to diverge as other developed nations such as England, Norway, Switzerland, and Australia elected to continue their hiking cycle due to elevated rates of inflation. The Fed also released their Summary of Economic Projections in which the median estimate for the Fed Fund rate for the end of 2023 was 5.6%. Just a month ago, the market was pricing in rate cuts as soon as November. Markets are finally pricing in elevated levels of interest rates for longer with no rate cuts occurring until Q1 2024.
- Headline CPI cooled to 4.0% from 4.9% in May and the reading for June is likely to be lower as hot 2022 numbers roll off the year-over-year calculation. Six-month annualized headline CPI is still above average at 3.2% but cooling. Six-month annualized core inflation on the other hand is running at 5.1% and rising. The largest detractor from inflation right now are energy commodity prices. Most other components are still elevated and will take some time before they return to more normalized levels. Shelter inflation remains the largest component as prices have yet to meaningfully cool. The low supply of existing homes on the market due to high mortgage rates have kept home prices elevated.
- While consumer sentiment has risen from its low in June 2022 (63.9 vs 50.0), the gap between current economic conditions and future expectations is widening again after a brief respite earlier this year. Consumers are most pessimistic about buying conditions due to high prices and interest rates, especially for large durable goods, cars, and homes. Investors allocation to equities are at a 13-month high, according to the AAII Sentiment Survey and overall, consumers and investors have no shortage of confidence and are taking on more risk and margin once again.
- Part of the increase in optimism has been driven by stellar real GDP growth which was revised higher to 2.0% from 1.4% QoQ annualized for Q1 2023. The revision was mostly influenced by increased consumer spending. Estimates for Q2 are currently 1.3% QoQ annualized, with the Atlanta Fed’s estimate even higher at 2.3%. However, forecasts for the rest of the year and early next year fall due to decreased business fixed investment and residential investment.
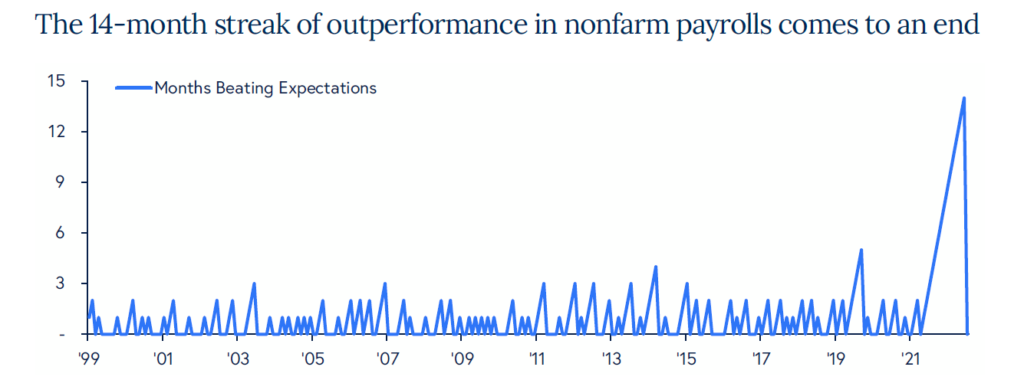
- While payrolls continue to move higher, June snapped a 14-month streak of beating analyst estimates. The US economy added 209k jobs in June vs. 230k estimated. A decent mix of high paying and lower pay jobs were added last month including 65k health care jobs and 23k construction jobs. However, retail jobs have been lost in 3 of the last 4 months and food service jobs were also lower in June after 30 months of job growth. Wages came in slightly higher than expected last month but have moved down to 4.35% YoY vs. 5.90% YoY in March 2022. The labor force participation rate for key aged workers (25-54 years) is at its highest point since 2002, a crucial sign that people are coming back to work. For as many signs that show that the labor market is cracking there continue to be more that signal strength.
You cannot invest directly in an index; therefore, performance returns do not reflect any management fees. Returns of the indices include the reinvestment of all dividends and income, as reported by the commercial databases involved. Returns over one year have been annualized.
Source — Bloomberg, Morningstar, treasury.gov. S&P Dow Jones Indices.
Disclosures
Past Performance Is No Guarantee of Future Performance. Any opinions expressed are current only as of the time made and are subject to change without notice. This report may include estimates, projections or other forward looking statements, however, due to numerous factors, actual events may differ substantially from those presented. The graphs and tables making up this report have been based on unaudited, third-party data and performance information provided to us by one or more commercial databases. Additionally, please be aware that past performance is not a guide to the future performance of any manager or strategy, and that the performance results and historical information provided displayed herein may have been adversely or favorably impacted by events and economic conditions that will not prevail in the future. Therefore, it should not be inferred that these results are indicative of the future performance of any strategy, index, fund, manager or group of managers. While we believe this information to be reliable, Pathstone bears no responsibility whatsoever for any errors or omissions. Index benchmarks contained in this report are provided so that performance can be compared with the performance of well-known and widely recognized indices. Index results assume the re-investment of all dividends and interest. Moreover, the information provided is not intended to be, and should not be construed as, investment, legal or tax advice. Nothing contained herein should be construed as a recommendation or advice to purchase or sell any security, investment, or portfolio allocation. Any investment advice provided by Pathstone is client specific based on each clients’ risk tolerance and investment objectives. This presentation is not meant as a general guide to investing, or as a source of any specific investment recommendations, and makes no implied or express recommendations concerning the manner in which any client’s accounts should or would be handled, as appropriate investment decisions depend upon the client’s specific investment objectives.
U.S. Large Cap Equity is represented by the S&P 500 Index, with dividends reinvested. U.S. Small Cap Equity is represented by the Russell 2000 Index. Developed Non-U.S. Equity is represented by the MSCI EAFE Index. Emerging Market Equity is represented by the MSCI EM Index. Real Estate is represented by the S&P Global Property Index. Commodities are represented by the Bloomberg Commodity Index. Natural Resource Equities are represented by the S&P North American Natural Resources Index. U.S. High Yield Debt is represented by the Bloomberg Barclays U.S. Corporate High Yield Index. Emerging Market Debt is represented by the JPM GMI-EM Global Diversified Index. U.S. Aggregate Bonds is represented by the Bloomberg Barclays U.S. Aggregate Bond Index. U.S. Treasuries is represented by the Bloomberg Barclays U.S. Treasury Index. U.S. Municipal Bonds is represented by the Bloomberg Barclays Municipal 1-10yr Index.