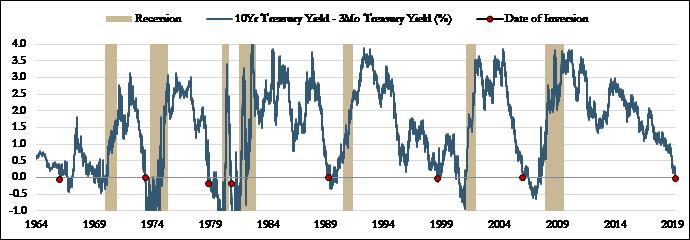
Source — St. Louis Fed. Periods before 1982 represent the 3-Month Treasury Bill: Secondary Market Rate from the St. Louis Fed.
On March 22nd, the yield curve as measured by the 3 month vs. the 10-year turned negative as the 3-month closed with a yield of 2.46% and the ten-year 2.44%. Looking back over the last 50 years the data shows that this indicator has arrived anywhere between 5 to 47 months before a recession, with a median of 15 months. Despite the fact that the 3-month/10-year inversion only lasted a week before righting itself we believe it is worth the extra precaution to review history for additional clues as to what may be next.
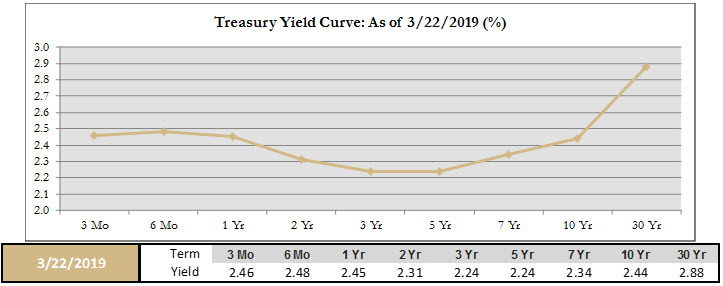
Source — Treasury.gov
Each time period is different and expansion can proceed for many months after inversion. Historically the Fed has been on a rate hiking cycle, typically raising rates right into yield curve inversion. After inversion the path of rates has varied. During a slowdown the Fed typically cuts interest rates to help stimulate growth, however different levels of inflation tend to determine the path of rates, notably during the high inflationary period of the 1970’s. A timelier signal for the onset of recession may be when the Fed begins to cut rates.
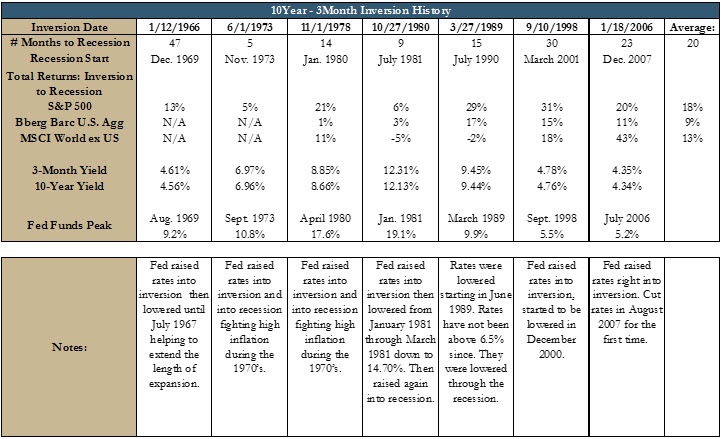
History of Yield Curve Inversion
Source — Return data from Bloomberg. Historical yields St. Louis Fed based on monthly data. Periods before 1982 represent the 3-Month Treasury Bill: Secondary Market Rate from the St. Louis Fed.
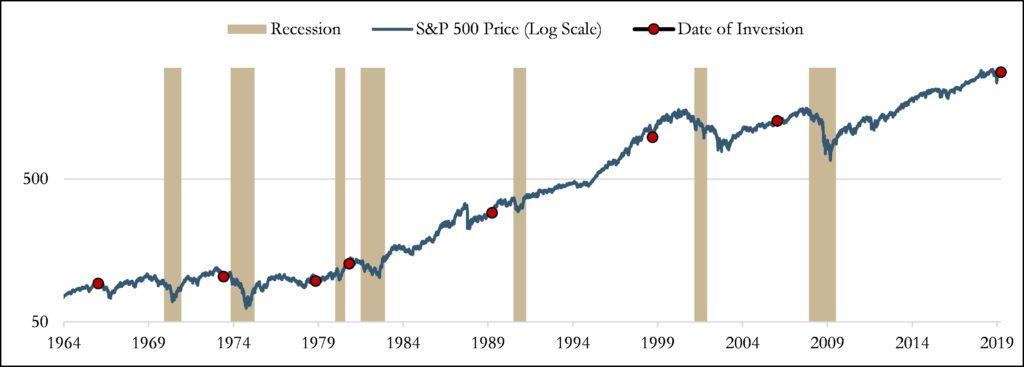
Market Performance after Inversion:
While yield curve inversion is a leading indicator it does not indicate immediate recession risk or the onset of a bear market. Inversion should be considered a flashing yellow signal indicating “proceed with caution” rather than a red stop light signaling “take risk off the table.” Markets can continue to run for some time after inversion as shown by the 18% average total return from the S&P 500 after the past seven inversion periods. Additionally the S&P 500 has historically outperformed the Bloomberg Barclays US Aggregate bond index over each of these time periods, meaning appetite for riskier equity investments continued on for several months.
Source — Return data from Bloomberg. Historical yields St. Louis Fed based on monthly data. Periods before 1982 represent the 3-Month Treasury Bill: Secondary Market Rate from the St. Louis Fed.
What comes next? What other indicators are we focused on?
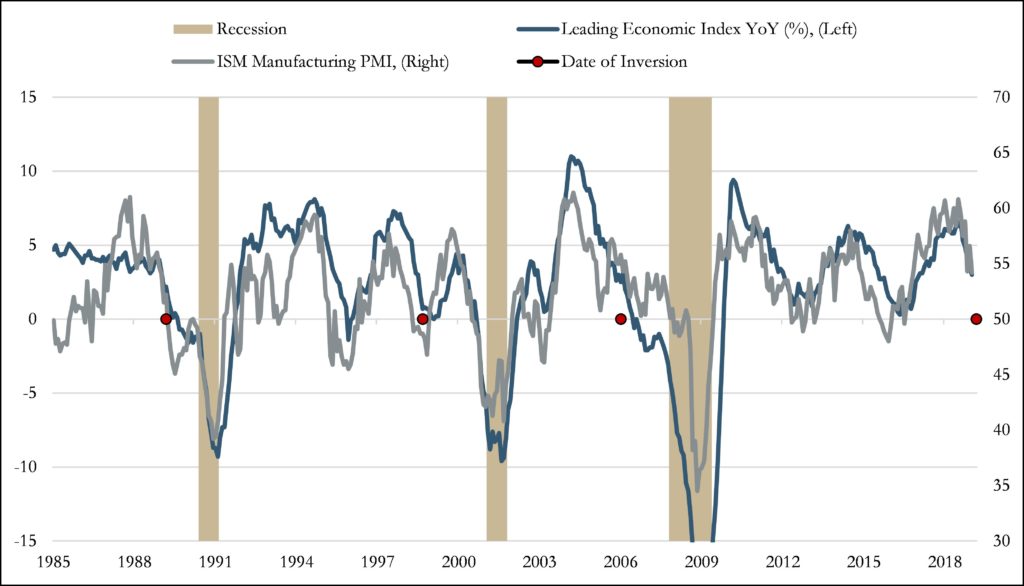
Now that inversion has occurred we turn our focus toward other factors that also tend to correspond with broad deterioration of economic fundamentals. Looking at the past three recessions, the yield curve inverting coincided with a weakening of economic conditions (as shown in the graph below) where the Leading Economic Index was entering negative year over year growth and Manufacturing PMIs were entering contractionary levels (readings below 50 reflect contraction). Notably in the late 90’s period the Fed cut interest rates helping to extend the length of economic expansion amid softening fundamentals, which allowed the economy to continue expanding for another 30 months before recession hit in early 2001.
Source — Bloomberg
Conditions today, while reflecting a slowing pace of growth, remain above levels seen during past recessionary periods. The Leading Economic Index points to further growth ahead. Survey data of manufacturing purchasing managers remains at expansionary levels. Employment remains strong with moderate real wage growth. Financial conditions are not yet restrictive. Broadly speaking we are not yet seeing a widespread weakening of data that we would expect to correspond with an oncoming recession. In the graph above it is clear that the ISM Manufacturing PMI and Leading Economic Index tend to vacillate in a regular pattern of “no growth (PMI levels at 50)” to more rapid growth in between recessions, so a downward trend is not particularly a reliable indicator of a recession to come.
How does the past history of yield curve inversions coincide with Pathstone’s Market Cycle Dashboard?
This reiterates how and why we built our Market Cycle Dashboard. No one indicator is perfect or works in every environment, and individual data points can be noisy so we focus on the trends in the underlying data. We use a diverse range of factors to gauge if the trend of the data is broadly improving or broadly weakening to levels that indicate caution which should be reflected in our asset allocation.
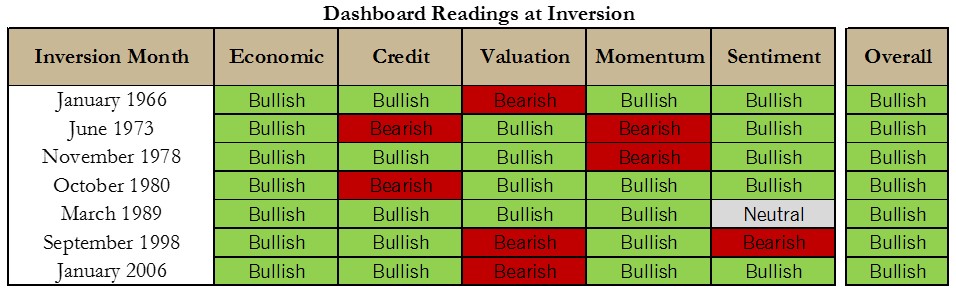
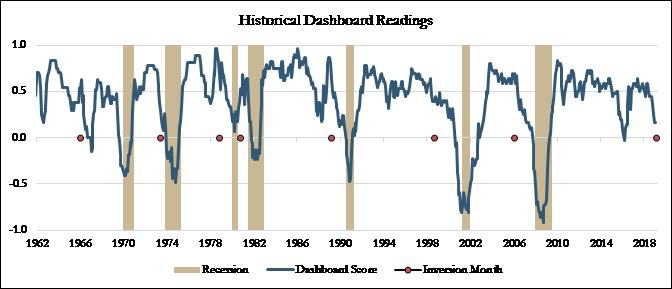
Not surprisingly our dashboard had a positive score at each of the past seven instances the yield curve inverted. Given that recessions didn’t begin until 20 months after inversion on average, you might expect that our dashboard would be reflective of a continued runway for growth. Historically this has been the case and continues today. During each of the previous periods when inversion first occurred the trend of economic data was bullish. Credit, Valuation, Momentum, and Sentiment have had various bearish or bullish readings but the overall underlying fundamentals were positive. Further, during past recessionary periods both Economic and Credit factors groups have had overall negative readings on our Dashboard, with the exception of July 1981 and November 1973 when Economic factors turned bearish within two months of the official recession start.
Today our Dashboard reflects expensive Valuations and bearish Sentiment, though Momentum, Credit, and Economic factors are largely positive. We look for further weakness in Economic and Credit factors as indication that significant recession risks are present.
Source — Bloomberg and Pathstone proprietary calculations
The current cycle will come to an end eventually and presently there is plenty of uncertainty looming that could derail growth. However we constantly monitor underlying fundamentals and recognize that while the Dashboards are closer to a tipping point than they have been in recent years, they do still remain positive, suggesting the risk of recession is not imminent. We remain disciplined to our process focusing on our Dashboard to mitigate the impact of our emotions. The yield curve inversion represents just one signal and we continue to watch for additional factors to reflect bearish before our dashboard will indicate an overall heightened likelihood of recession.