Key Takeaways
- Market News: Despite a slow start, U.S. Large Caps finished the month strong as real GDP and payroll growth continued to be robust and inflation was mild. Small caps lagged on renewed concerns of stress in the banking sector as New York Community Bancorp announced an earnings decline and slashed their dividend by 70%. Over the last 3 months, however, small caps have outperformed the S&P 500 as the economy has improved.
- Fixed Income: Treasury yields moved higher throughout most of the month as job openings and claims for unemployment fell and retail sales and manufacturing sector growth beat expectations. Speculators betting on a March rate cut were let down by hawkish language from Fed Chair Jay Powell and by the strong jobs report for January. Bonds underperformed as a result and all major sectors were flat or negative for the month. The “higher for longer” conversation could cut short the rally that took place over the previous three months which had been spectacular for an asset class that has disappointed the past few years.
- Commodities: Broad commodities were slightly higher in January as oil prices rose about 6%. Conflicts in the Middle East are partly responsible for higher oil prices and have caused shipping rates to spike as container ships are avoiding the Red Sea due to the threat of Houthi attacks.
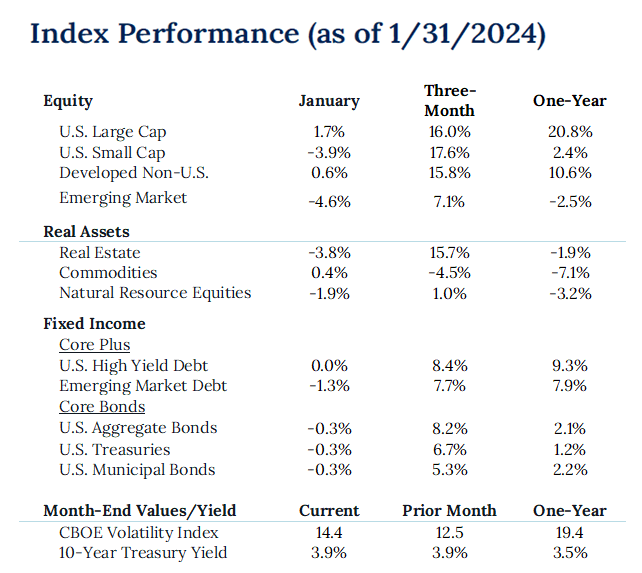
You cannot invest directly in an index; therefore, performance returns do not reflect any management fees. Returns of the indices include the reinvestment of all dividends and income, as reported by the commercial databases involved. Returns over one year have been annualized.
Source — Sources: Bloomberg, Morningstar, treasury.gov. S&P Dow Jones Indices.
Disclosures
Past Performance Is No Guarantee of Future Performance. Any opinions expressed are current only as of the time made and are subject to change without notice. This report may include estimates, projections or other forward looking statements, however, due to numerous factors, actual events may differ substantially from those presented. The graphs and tables making up this report have been based on unaudited, third-party data and performance information provided to us by one or more commercial databases. Additionally, please be aware that past performance is not a guide to the future performance of any manager or strategy, and that the performance results and historical information provided displayed herein may have been adversely or favorably impacted by events and economic conditions that will not prevail in the future. Therefore, it should not be inferred that these results are indicative of the future performance of any strategy, index, fund, manager or group of managers. While we believe this information to be reliable, Pathstone bears no responsibility whatsoever for any errors or omissions. Index benchmarks contained in this report are provided so that performance can be compared with the performance of well-known and widely recognized indices. Index results assume the re-investment of all dividends and interest. Moreover, the information provided is not intended to be, and should not be construed as, investment, legal or tax advice. Nothing contained herein should be construed as a recommendation or advice to purchase or sell any security, investment, or portfolio allocation. Any investment advice provided by Pathstone is client specific based on each clients’ risk tolerance and investment objectives. This presentation is not meant as a general guide to investing, or as a source of any specific investment recommendations, and makes no implied or express recommendations concerning the manner in which any client’s accounts should or would be handled, as appropriate investment decisions depend upon the client’s specific investment objectives.
U.S. Large Cap Equity is represented by the S&P 500 Index, with dividends reinvested. U.S. Small Cap Equity is represented by the Russell 2000 Index. Developed Non-U.S. Equity is represented by the MSCI EAFE Index. Emerging Market Equity is represented by the MSCI EM Index. Real Estate is represented by the S&P Global Property Index. Commodities are represented by the Bloomberg Commodity Index. Natural Resource Equities are represented by the S&P North American Natural Resources Index. U.S. High Yield Debt is represented by the Bloomberg Barclays U.S. Corporate High Yield Index. Emerging Market Debt is represented by the JPM GMI-EM Global Diversified Index. U.S. Aggregate Bonds is represented by the Bloomberg Barclays U.S. Aggregate Bond Index. U.S. Treasuries is represented by the Bloomberg Barclays U.S. Treasury Index. U.S. Municipal Bonds is represented by the Bloomberg Barclays Municipal 1-10yr Index.