Key Takeaways
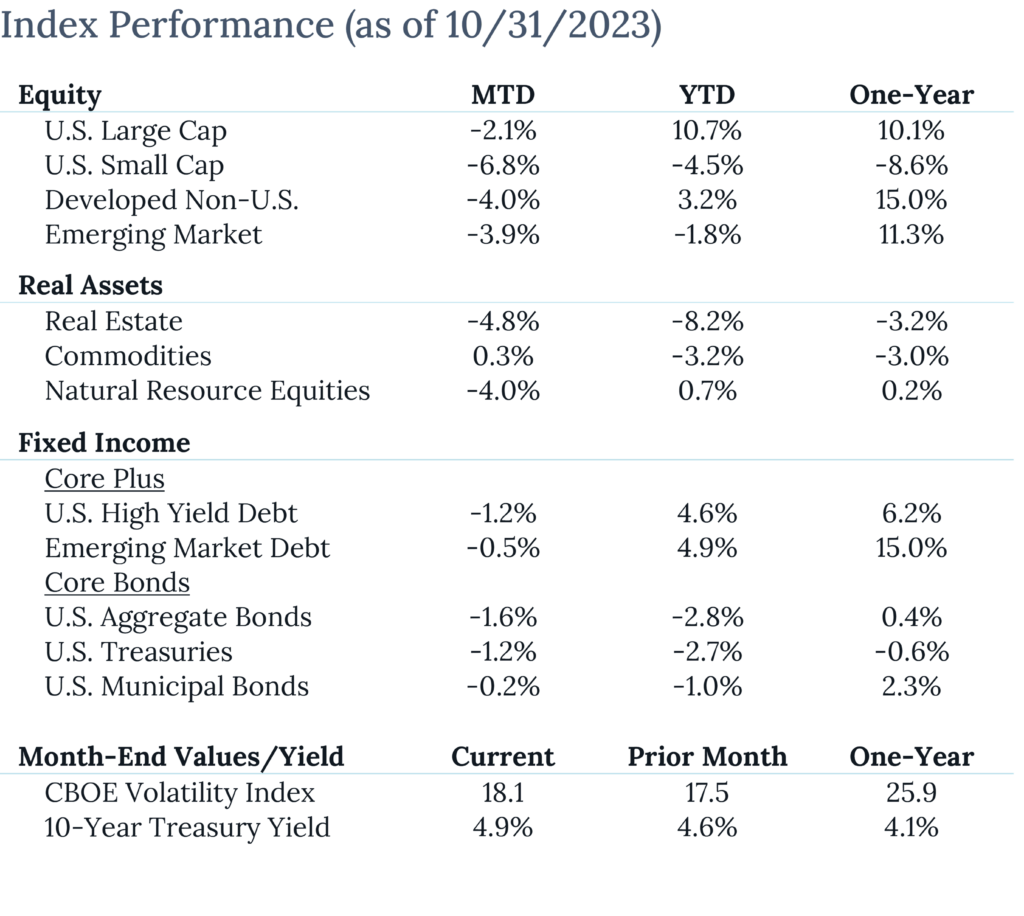
- Market News: The “good news is bad news” trend continued in October, as real GDP increased significantly (+4.9% QoQ annualized) and payrolls were higher than anticipated. The S&P 500 tumbled another -2.1%, marking the 3rd consecutive down month for the large cap index. The Equal Weighted S&P 500 index fared worse (-4.1%) and is down -2.4% YTD vs. +10.7% YTD for the market cap weighted index.
- Small Caps: The Russell 2000 had its worst month (-6.8%) since September 2022, pulled lower by health care (-9.9%), tech (-8.8%), and telecom (-8.2%) stocks. Small cap equities have been heavily impacted by higher rates as they have much less bargaining power than mega caps. Inflation came in hotter than the previous month at +3.7% YoY and is another data point for the Fed to keep rates at current levels for longer.
- Commodities: While oil prices were lower in October, other commodities such as silver and gold pushed the Bloomberg Commodity Index higher +0.3%. Commodities were the one bright spot in October as investors flowed into “safe haven” and uncorrelated assets.
- Bonds: The 10-year Treasury yield hit 5% for the first time since 2007. The rise of the long end of the curve pushed bond prices down during the month. Two sectors that have performed well in 2023 (High Yield & EM Debt) were lower as investors went more risk-off in October. Short-duration continued to outperform longer-duration bonds as the short end of the curve stayed relatively flat.
You cannot invest directly in an index; therefore, performance returns do not reflect any management fees. Returns of the indices include the reinvestment of all dividends and income, as reported by the commercial databases involved. Returns over one year have been annualized.
Source — Sources: Bloomberg, Morningstar, treasury.gov. S&P Dow Jones Indices.
Disclosures
Past Performance Is No Guarantee of Future Performance. Any opinions expressed are current only as of the time made and are subject to change without notice. This report may include estimates, projections or other forward looking statements, however, due to numerous factors, actual events may differ substantially from those presented. The graphs and tables making up this report have been based on unaudited, third-party data and performance information provided to us by one or more commercial databases. Additionally, please be aware that past performance is not a guide to the future performance of any manager or strategy, and that the performance results and historical information provided displayed herein may have been adversely or favorably impacted by events and economic conditions that will not prevail in the future. Therefore, it should not be inferred that these results are indicative of the future performance of any strategy, index, fund, manager or group of managers. While we believe this information to be reliable, Pathstone bears no responsibility whatsoever for any errors or omissions. Index benchmarks contained in this report are provided so that performance can be compared with the performance of well-known and widely recognized indices. Index results assume the re-investment of all dividends and interest. Moreover, the information provided is not intended to be, and should not be construed as, investment, legal or tax advice. Nothing contained herein should be construed as a recommendation or advice to purchase or sell any security, investment, or portfolio allocation. Any investment advice provided by Pathstone is client specific based on each clients’ risk tolerance and investment objectives. This presentation is not meant as a general guide to investing, or as a source of any specific investment recommendations, and makes no implied or express recommendations concerning the manner in which any client’s accounts should or would be handled, as appropriate investment decisions depend upon the client’s specific investment objectives.
U.S. Large Cap Equity is represented by the S&P 500 Index, with dividends reinvested. U.S. Small Cap Equity is represented by the Russell 2000 Index. Developed Non-U.S. Equity is represented by the MSCI EAFE Index. Emerging Market Equity is represented by the MSCI EM Index. Real Estate is represented by the S&P Global Property Index. Commodities are represented by the Bloomberg Commodity Index. Natural Resource Equities are represented by the S&P North American Natural Resources Index. U.S. High Yield Debt is represented by the Bloomberg Barclays U.S. Corporate High Yield Index. Emerging Market Debt is represented by the JPM GMI-EM Global Diversified Index. U.S. Aggregate Bonds is represented by the Bloomberg Barclays U.S. Aggregate Bond Index. U.S. Treasuries is represented by the Bloomberg Barclays U.S. Treasury Index. U.S. Municipal Bonds is represented by the Bloomberg Barclays Municipal 1-10yr Index.