
Quarterly Commentary
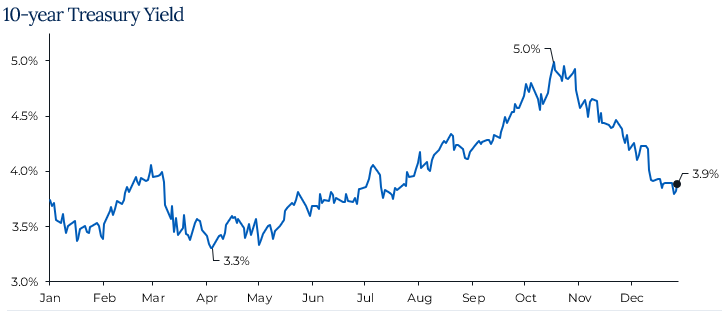
US Treasuries: Arguably, the most pivotal moment of 2023 was the Treasury’s announcement that they would issue fewer bonds than expected, especially longer-term bonds. This pushed yields lower and equities rallied massively the final two months of the year after slumping during the summer and into October. The 10-year treasury yield (chart below) ended the year more-or-less where it started after moving from a low of 3.3% after the mini banking crisis to a high of around 5%. This proved to be a critical inflection point in markets as US equities were down almost -10% from their July high through the end of October, only to reverse course and finish the year up +26%.
Monetary Policy: In the final FOMC meeting of the year the Fed decided to keep their benchmark rate unchanged at 5.5%. They also released their Summary of Economic Projections (SEP) which includes the “Dot Plot”. In the SEP, the Fed is projecting three 25 bps rate cuts in 2024 and for PCE inflation to fall to +2.4% YoY (currently +2.6%) as economic growth cools and unemployment rises slightly. Their base case presents a soft-landing scenario which is a departure from their projections this point a year ago.
Inflation: Headline CPI currently resides at +3.1% YoY and core slightly higher at +4.0%. Falling energy prices has helped moderate the overall level of prices, but there are a few segments that are rising at above average rates. Core services are one such segment as items like transportation (car maintenance and insurance) are still rising over +10% YoY. Shelter costs remain an outsized factor contributing to inflation. Home prices and rents have held up despite higher rates and in October the Case-Shiller Home Price Index hit a new all-time high which could prevent inflation readings from cooling at the same pace.
Labor Market: Jobless and continuing claims for unemployment had been rising steadily from very low levels and have moderated over the past few weeks. The unemployment rate, which many economists believed would be over 4% by year end, sits at 3.7% and has remained below 4% for 23 consecutive months which is the 3rd longest streak on record. Immigration has proven to be a key contributor to net jobs added last year, but that is unlikely to continue indefinitely. Additionally, many businesses are reporting that their plans to hire are slowing down and services jobs are starting to slowdown.
US Economy: Real GDP for Q323 came in at almost +5% QoQ annualized as consumer and government spending continues to surprise. As of now, growth for Q4 is projected to be right on trend at 2% but economists are estimating that growth will be below trend in 2024. Consumer confidence has risen rapidly as the stock market was up and gas prices were down in Q4. By all accounts, 2023 was a Goldilocks year. The labor market and economic growth were strong and inflation cooled. Markets have high hopes for 2024 and have priced in six 25 bps rate cuts during the year including about a 70% chance of a cut in March. With high hopes could come disappointment if one of these economic factors misses early on in ’24.
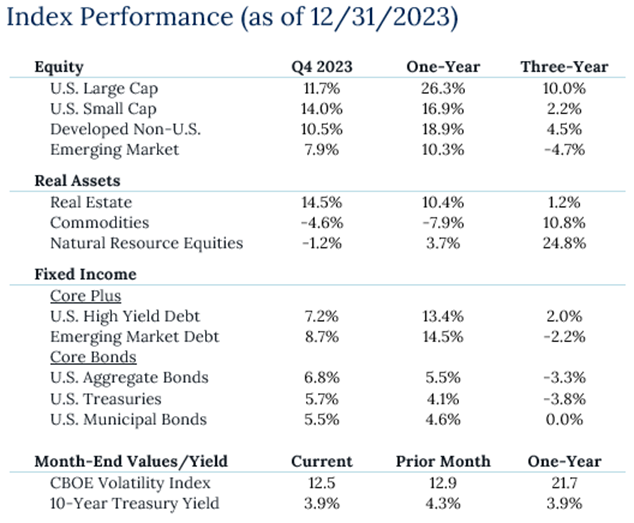
You cannot invest directly in an index; therefore, performance returns do not reflect any management fees. Returns of the indices include the reinvestment of all dividends and income, as reported by the commercial databases involved. Returns over one year have been annualized.
Source — Sources: Bloomberg, Morningstar, treasury.gov. S&P Dow Jones Indices.
Source — Sources: Bloomberg, Morningstar, treasury.gov. S&P Dow Jones Indices.
Disclosures
Past Performance Is No Guarantee of Future Performance. Any opinions expressed are current only as of the time made and are subject to change without notice. This report may include estimates, projections or other forward looking statements, however, due to numerous factors, actual events may differ substantially from those presented. The graphs and tables making up this report have been based on unaudited, third-party data and performance information provided to us by one or more commercial databases. Additionally, please be aware that past performance is not a guide to the future performance of any manager or strategy, and that the performance results and historical information provided displayed herein may have been adversely or favorably impacted by events and economic conditions that will not prevail in the future. Therefore, it should not be inferred that these results are indicative of the future performance of any strategy, index, fund, manager or group of managers. While we believe this information to be reliable, Pathstone bears no responsibility whatsoever for any errors or omissions. Index benchmarks contained in this report are provided so that performance can be compared with the performance of well-known and widely recognized indices. Index results assume the re-investment of all dividends and interest. Moreover, the information provided is not intended to be, and should not be construed as, investment, legal or tax advice. Nothing contained herein should be construed as a recommendation or advice to purchase or sell any security, investment, or portfolio allocation. Any investment advice provided by Pathstone is client specific based on each clients’ risk tolerance and investment objectives. This presentation is not meant as a general guide to investing, or as a source of any specific investment recommendations, and makes no implied or express recommendations concerning the manner in which any client’s accounts should or would be handled, as appropriate investment decisions depend upon the client’s specific investment objectives.
U.S. Large Cap Equity is represented by the S&P 500 Index, with dividends reinvested. U.S. Small Cap Equity is represented by the Russell 2000 Index. Developed Non-U.S. Equity is represented by the MSCI EAFE Index. Emerging Market Equity is represented by the MSCI EM Index. Real Estate is represented by the S&P Global Property Index. Commodities are represented by the Bloomberg Commodity Index. Natural Resource Equities are represented by the S&P North American Natural Resources Index. U.S. High Yield Debt is represented by the Bloomberg Barclays U.S. Corporate High Yield Index. Emerging Market Debt is represented by the JPM GMI-EM Global Diversified Index. U.S. Aggregate Bonds is represented by the Bloomberg Barclays U.S. Aggregate Bond Index. U.S. Treasuries is represented by the Bloomberg Barclays U.S. Treasury Index. U.S. Municipal Bonds is represented by the Bloomberg Barclays Municipal 1-10yr Index.