Key Takeaways
- Equity returns were largely mixed over the third quarter, but remain impressive on a year-to-date basis. Large cap U.S. equities delivered positive returns, leaving the S&P 500 up over 20% year-to-date. Overseas equities didn’t fare as positively, falling slightly during the quarter―in U.S. dollar terms―as the rebound in September wasn’t enough to make up for August’s slump.
- U.S. dollar strength has been resilient, increasing over 4% versus the euro during the quarter and causing non-U.S. equity returns to look inferior. In local currency terms, the MSCI EAFE Index increased 1.8% in Q3 compared to a drop of 1.1% in dollar terms.
- The steady decline in interest rates over the past 12 months has benefited fixed income investors. The U.S. Agg has returned an impressive 10.3% on a trailing 12-month basis.
- Central banks have responded to the global slowdown and uncertain outlook. Investors expected easier monetary policy, and the Fed delivered two interest rate cuts over the quarter. The ECB cut rates further into negative territory and resumed their Asset Purchase Program.
- Sentiment continues to ebb and flow with news headlines. The status of trade talks has proved difficult to keep up with, as dynamics seem to change on a daily basis. Escalating threats of increased tariff rates have been somewhat offset, as the implementation dates get delayed. Talks between the U.S. and China are scheduled to resume, but a lack of progress leaves little for investors to feel optimistic about.
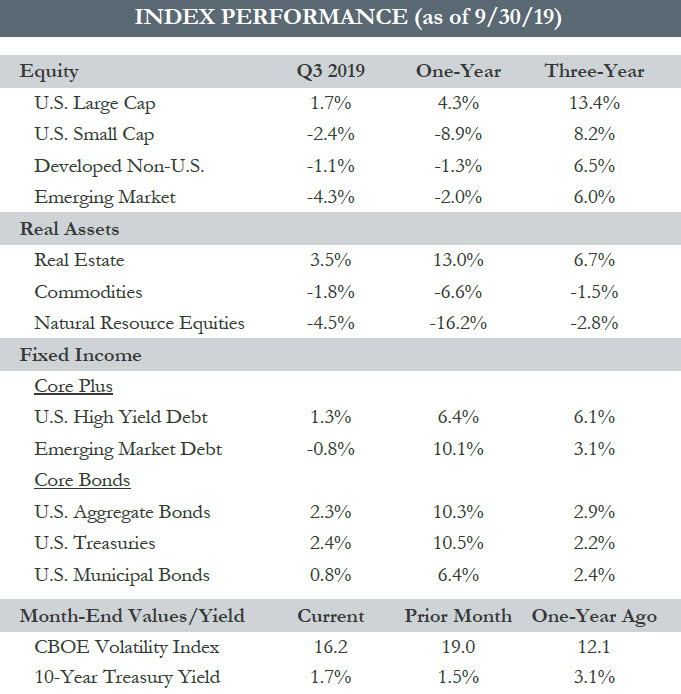
You cannot invest directly in an index; therefore, performance returns do not reflect any management fees. Returns of the indices include the reinvestment of all dividends and income, as reported by the commercial databases involved.
Source — Bloomberg, Morningstar, treasury.gov. S&P Dow Jones Indices.
Quarterly Commentary
- The two major themes of the year, trade and monetary policy, continue to drive the narrative for markets. Economic growth around the globe has moderated, and trade frictions have been an added headwind.
- Equity returns on a year-to-date basis have been impressive across the board. The S&P 500 is up 20.6%, the Russell 2000 is up 14.2%, the MSCI EAFE is up 12.8%, and the MSCI EM Index is up 5.9%. However, taking a step back and reviewing the trailing 12-month period shows returns have been less than spectacular.
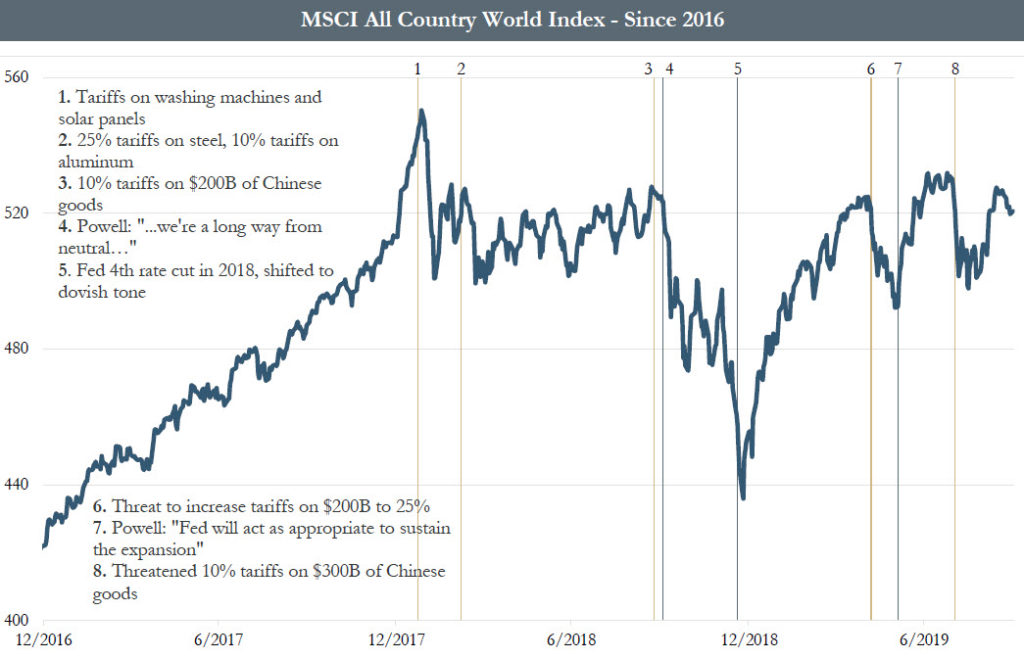
- It might not come as a surprise that global equities have moved sideways for nearly two years, amidst wavering investor sentiment. Despite revenue growth of almost 6% and EPS growth of 10% since the end of 2017, the MSCI ACWI Index has returned -1.9% since prices peaked on January 26th, 2018.
- As the chart below shows, most significant turning points for the market over the past two years have occurred around major headlines relating to these two themes. With trade headlines unlikely to disappear anytime soon, we anticipate that volatility will continue.
- We recognize that economic fundamentals around the world have been deteriorating. Our dashboards look across a broad set of factors, and we’ve seen the score decline in sync with the global slowdown. However, the overall reading still leans positive. Investors are challenged today with determining whether recession is imminent or whether monetary policy by central banks and potentially fiscal policy can extend the cycle.
- With a diverse range of potential outcomes, investors may feel motivated to “do something.” This should be expected. At times like this, it is important to take a step back and remind oneself that a disciplined process is many times more successful than emotional decision making. We utilize our dashboards to help maintain that discipline and not allow our emotions to take control of the steering wheel. Recognizing that most investors fail to meet their return objectives over time because of emotion-driven decision making should serve as a reminder to pause and revisit your investment discipline, so that you know how you want to respond to different market situations now and in the future.
You cannot invest directly in an index; therefore, performance returns do not reflect any management fees. Returns of the indices include the reinvestment of all dividends and income, as reported by the commercial databases involved.
Source — Bloomberg. Reuters.
Please read important disclosures in the PDF version of this article.