KEY TAKEAWAYS
- Markets bounced back in the first quarter providing a nice reprieve for investors as all major indicies finished the first three months of the year positive. While a majority of the gains were made during January’s swift rally, markets were broadly positive in February and March as well.
- The first three months of 2019 represent the best quarter for the S&P 500 since Q3 2009. Gains came as Fed officals walked back their tone on the pace of rate increases, reducing fears that raising rates too much would choke off growth. Perceived progress on trade negotiations between the U.S and China similarly helped boost investor sentiment.
- The path forward for Brexit remains unclear as the original March 29th deadline has come and gone. Parliament continues to vote on alternatives to the deal that Prime Minister Theresa May negotiated. As things stand currently the UK has until April 12th to decide on its future relationship with the EU or risk leaving without a deal if no solution is agreed upon.
- The Fed’s decision to keep rates unchanged came with little surprise. Guidance now points to no rate increases this year, down from two previously signaled in the Fed’s Dot Plot. The low for longer tone from both the Fed and ECB has caused Treasury yields to fall, leading the yeild curve to briefly invert (as measured by the 3 month yield compared to the 10 year yield).
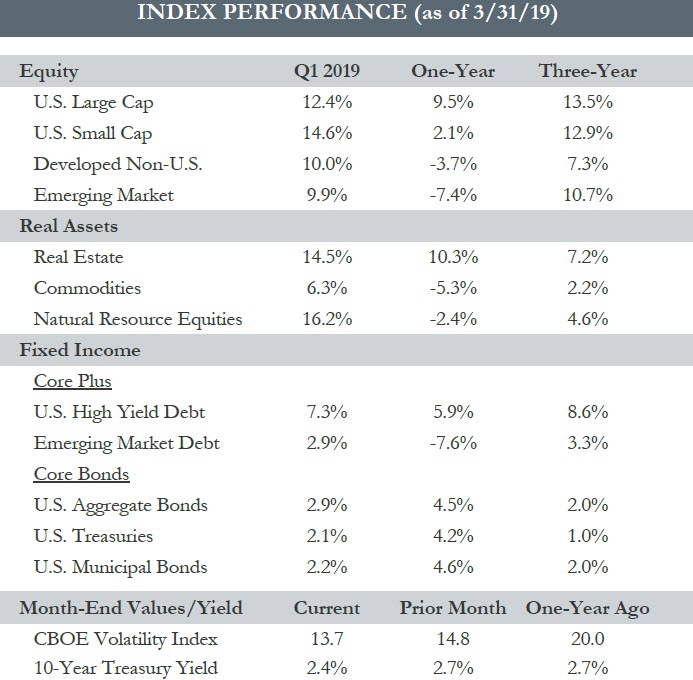
You cannot invest directly in an index; therefore, performance returns do not reflect any management fees. Returns of the indices include the reinvestment of all dividends and income, as reported by the commercial databases involved.
Source — Bloomberg, Morningstar, treasury.gov. S&P Dow Jones Indices.
QUARTERLY COMMENTARY
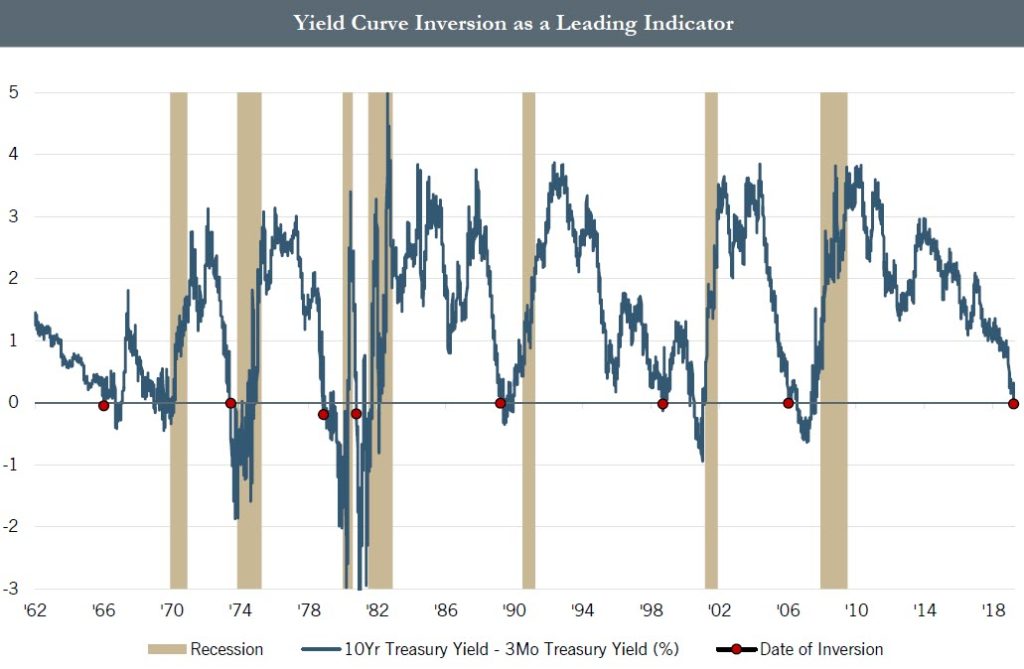
- The bond market stole the attention of investors toward the end of the quarter as long term Treasury yields fell below short term yields, causing inversion of the yield curve. On March 22nd the 3 month Treasury yield of 2.46% was higher than the 10 year Treasury yield of 2.44%.
- As the Fed pivoted to signal no further rate increases this year, the yield on the 10-year Treasury fell ending the quarter at 2.41%, down from 2.69% at the end of 2018.
- News headlines became littered with commentary of oncoming recession risks as an inverted yield curve has historically been a reliable leading indicator of recession.
- While a heightened sense of caution may be warranted it is not yet time for investors to run for the hills. Inversion has preceeded the start of recession by around 20 months on average and markets have historically advanced between inversion and the start of recession by an average of 18% (as represented by the S&P 500).
- Broadly speaking economic fundamentals remain supportive of the current expansion. Inversion represents just one signal that we appear closer to the end of the cycle than not. We now turn our attention toward several other factors on our U.S. Market Cycle Dashboard for indication that a heightened risk of recession is on the horizon.
You cannot invest directly in an index; therefore, performance returns do not reflect any management fees. Returns of the indices include the reinvestment of all dividends and income, as reported by the commercial databases involved.
Source — Bloomberg. St. Louis Fed. Periods before 1982 represent the 3-Month Treasury Bill: Secondary Market Rate from the St. Louis Fed.